16 years of UK Accidents: The Good, The Bad, and the preventable — Part 1
A comprehensive study on accident data (2005–2021)
Ensuring road safety has become a crucial issue for many countries across the world, with the alarming rise in the number of road accidents resulting in fatalities and disabilities. Road crashes have now emerged as a major public health concern and a pressing issue that requires immediate attention. As responsible citizens, it is incumbent upon us to remain vigilant and aware of our surroundings while using the roads. This awareness, coupled with scientific knowledge and expertise, can help us to develop effective strategies and interventions to prevent road accidents and reduce their impact.

1.Introduction
2.Understanding the data
3.Exploratory Data Analysis
4.Applying Feature Engineering
5.Applying Machine Learning Algorithms
6.Final Result
7.Conclusion
Let’s get started………
I. Introduction
UK accident case study is the detailed analysis of all three data accidents, vehicles and casualties of UK traffic accidents and road safety. Here, I have targeted the first data i.e. accidents data to gain an understanding on the problem and develop insights & preventions related to it. I am going to use the data from 2005 to 2021.
When working on this case study from scratch , I am literally scratching my head to understand the basic ‘how’, ‘why’, ‘when’, ‘where’ reasons which caused accidents to happen. So without wasting any more time, let’s go deep dive into the data.
II. Understanding the data
Understanding the data of this case study is crucial for developing effective strategies to prevent road accidents. By analyzing the data, we can identify patterns and trends that can help us to better understand the underlying causes of accidents. This understanding can then be used to inform evidence-based policies and programs that can help to reduce the risk of accidents and improve road safety for all. I have collected the data from here under Open Government Licence.
III. Exploratory Data Analysis
In this section we will try to find out the answers of above basic questions which caused accidents to happen. Have a look at our data.

The amount of data is so massive, it’s making my brain feel like a squirrel trying to store an entire winter’s worth of nuts in its tiny little head! 😬
I have ensured that our dataset is free of missing values and made any necessary adjustments. Take a look at our clean data and see how it appears now.

Yay!! I must agree that clean data makes me happy.
Now , let’s visualize the data to understand better insights.

Accidents per year shows good downfall in the 16 years. Now we need to understand the features that affected them or prevented the accidents.
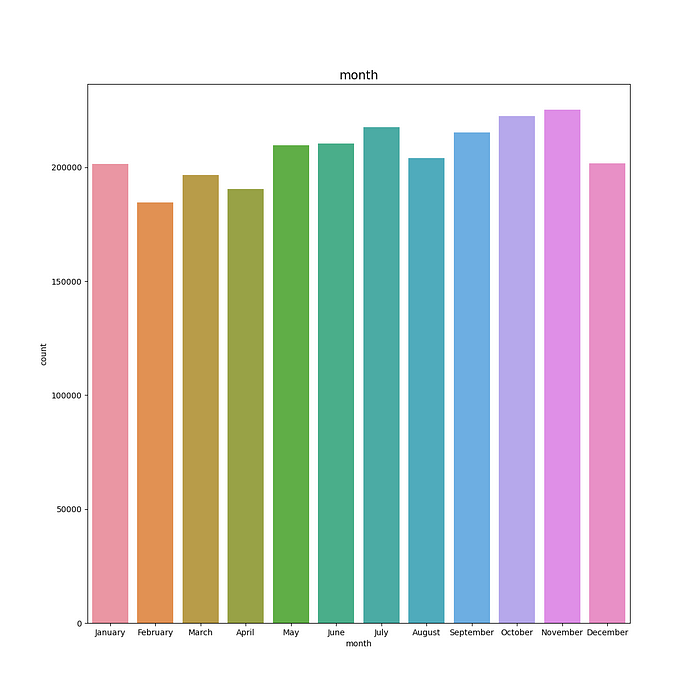
The number of accidents was consistently higher throughout all months where October and November have higher and December to February have lowest accidents.

It looks like there are fewer accidents on weekends than on weekdays. Friday has the most accidents and Sunday has the lowest.

We can clearly see that 8 AM in the morning and near to 16 PM have the darker lines on weekdays where the most accidents usually happen. Maybe it happens because it is the office time on weekdays so there must have been a rush.

We can see there are 3 types of accident severity, Serious, Slight and Fatal from which most accidents happen in slight severity.

Above graph shows the Accidents severity per year where slight severity is the highest in every year and Fatal is lowest. Also, 2020 is the year which has low accidents maybe because this was covid year and it slightly increased in 2021.


In the above graph, it shows the most accidents that had happened where the speed limit was 30, road type was single carriageway, mostly happened in Urban areas and road surface condition was dry, weather was Fine with no high winds. Most accidents had happened in the daylight. There were no special conditions and it was not within 20 meters of the junction. In most of the accident cases police officers attend the scene of the accident.
As all the features appeared to be important, I decided to perform feature engineering to reduce the complexity of the data and enable the use of multiple algorithms. This approach will allow us to better understand the underlying relationships between the features and target variable, and to identify the most relevant features for the problem being solved. Ultimately, this will improve the performance of our machine learning models and enable us to make more accurate predictions.
Give me the gift of knowledge and inspiration with a buying me a book . Let’s embark on a learning adventure together! 🌟📖
IV. Applying Feature Engineering : Extra Tree Classifier
I have used Extra Tree Classifier for this multiclass problem because it is an ensemble learning method that combines the advantages of both decision trees and bagging techniques. Extra Trees use a large number of randomized decision trees to predict the class of an observation, and each tree is trained on a different subset of the original features and observations. This randomness and diversity help to reduce overfitting, improve the stability of the model, and increase the accuracy of predictions. Additionally, Extra Trees can handle both numerical and categorical features, making it a suitable choice for multiclass problems with diverse feature types.

Plotted the graph with best 10 features with feature_importances_

So now, Our best selected features are:
1.time
2.accident_year
3.local_authority_district
4.month
5.local_authority_highway
6.First_road_number
7.day_of_week
8.Police_force
9.Number_of_vehicles
10.number_of_casualties
As we have studied and understood the data and the important features, now it’s time to apply different machine learning algorithms and measure their performance.
V. Applying Machine Learning Algorithm
1. Random Forest Algorithm
I chose this algorithm for this case study because this algorithm is known for its high accuracy in predicting outcomes, ability to handle complex datasets with a lot of features. Random Forest is a robust algorithm that is able to handle noise and outliers in the data. This makes it a good choice for datasets that may contain errors or anomalies. The results I have found using Random Forest:


We can see that the training and test accuracy are nearly same , it indicates RF is performing consistently on both the training and test datasets and its not overfitting. Confusion Matrix and Roc curves shows that model has done prediction slightly better for ‘Fatal’ than ‘Serious’ and ‘Slight’.
2. XGBoost
XGBoost is a boosting algorithm that iteratively builds weak decision trees and combines them to create a strong predictor. It is known for its superior performance on large and complex datasets, and it is particularly effective at reducing bias and variance in the model. XGboost gave me the nearly same results as Random Forest. The results are:


3. K-Nearest Neighbors
K-NN is a straightforward algorithm to implement and understand, making it a good choice for simple multiclass classification problems. K-NN is a non-parametric algorithm, which means that it makes no assumptions about the underlying distribution of the data. This can be an advantage in cases where the distribution of the data is unknown or complex. The results are :
By looking at all the results of KNN, I feel model is not performing well in distinguishing between the different classes.
4. AdaBoost Classifier
AdaBoost is a powerful algorithm for multiclass classification that can achieve high accuracy, handle class imbalance and noisy data, perform feature selection, and is easy to implement. It is a strong classifier, it can capture complex decision boundaries and improve the accuracy of the predictions.


AdaBoost gave same result as Random Forest and XGBoost. The model has fitted well and can distinguish between classes.
5. Bagging Classifier
Bagging is a technique used in machine learning to reduce the effects of noise in a dataset. It works by randomly selecting a sample of data from the training set. The same data point can be chosen more than once, as replacement is allowed.


Based on the given results, it seems like the bagging classifier is overfitting the training data as the training accuracy is very high (99%) compared to the test accuracy (82%).
husshh!! As a girl, I want to mention, I only compare algorithms — because who needs boys when you have the latest machine learning models to keep you company?
Right 😝!!
Enough Laughing, Let’s go check our final result.
6. Final Result

7. Conclusion
We found 10 big reasons that caused the most accidents. These include things like the time of day, number of vehicles involved, and the year and location of the accident. We tested five different methods on this data and they all did pretty well. It’s important to remember that road safety is everyone’s responsibility. Governments, organizations, and individuals all need to work together to make our roads safer. By doing this, we can make transportation better for everyone.
We will meet again here with part 2.
You can find the code in python on Github.
You can reach me on LinkedIn.
Stay tuned!